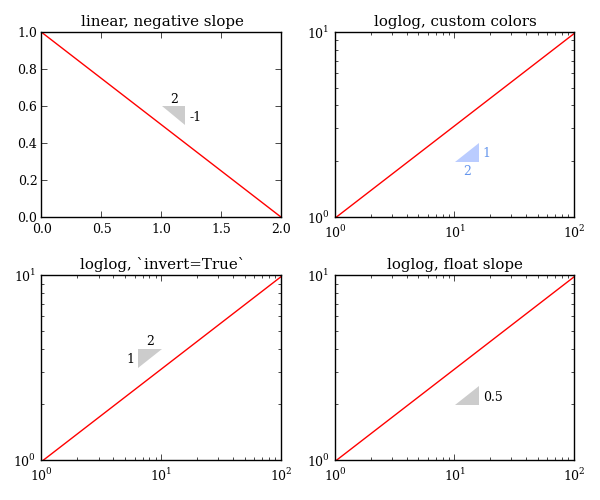
Slope marker
When viewing data, it’s often helpful to add a marker representing the predicted or measured slope. mpltools.annotation.slope_marker provides a simple way of adding a slope marker by specifying the origin of the marker (normally, the left-most corner of the marker, but, when invert=True, it’s the right-most corner) and the slope—either as a float value or a (rise, run) tuple.
import numpy as np
import matplotlib.pyplot as plt

from mpltools import annotation


x = np.logspace(0, 2)
fig, ((ax1, ax2), (ax3, ax4)) = plt.subplots(2, 2)

ax1.plot([0, 2], [1, 0])
annotation.slope_marker((1, 0.6), (-1, 2), ax=ax1)
ax1.set_title('linear, negative slope')

ax2.loglog(x, x**0.5)
annotation.slope_marker((10, 2), (1, 2), ax=ax2,
                        text_kwargs={'color': 'cornflowerblue'},
                        poly_kwargs={'facecolor': (0.73, 0.8, 1)})
ax2.set_title('loglog, custom colors')

ax3.loglog(x, x**0.5)
annotation.slope_marker((10, 4), (1, 2), invert=True, ax=ax3)
ax3.set_title('loglog, `invert=True`')

ax4.loglog(x, x**0.5)
annotation.slope_marker((10, 2), 0.5, ax=ax4)
ax4.set_title('loglog, float slope')

plt.tight_layout()
plt.show()
Python source code: download (generated using mpltools 0.2dev)