Color cycle from a colormap
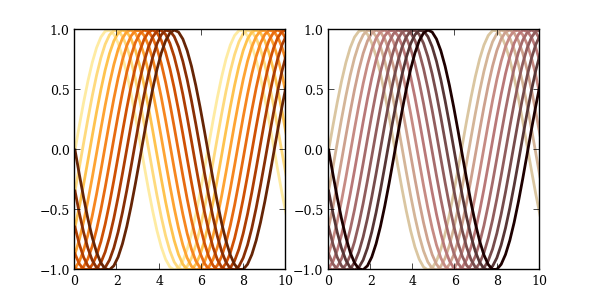
cycle_cmap provides a simple way to set the color cycle to evenly-spaced intervals of a given colormap. By default, it alters the default color cycle, but if you pass it a plot axes, only the color cycle for the axes is altered.
import numpy as np
import matplotlib.pyplot as plt

from mpltools import layout
from mpltools import color


n_lines = 10

# Change default color cycle for all new axes
color.cycle_cmap(n_lines)

figsize = layout.figaspect(aspect_ratio=0.5)
fig, (ax1, ax2) = plt.subplots(ncols=2, figsize=figsize)

# Change color cycle specifically for `ax2`
color.cycle_cmap(n_lines, cmap='pink', ax=ax2)

x = np.linspace(0, 10)
for shift in np.linspace(0, np.pi, n_lines):
    ax1.plot(x, np.sin(x - shift), linewidth=2)
    ax2.plot(x, np.sin(x - shift), linewidth=2)

plt.show()
Python source code: download (generated using mpltools 0.2dev)