


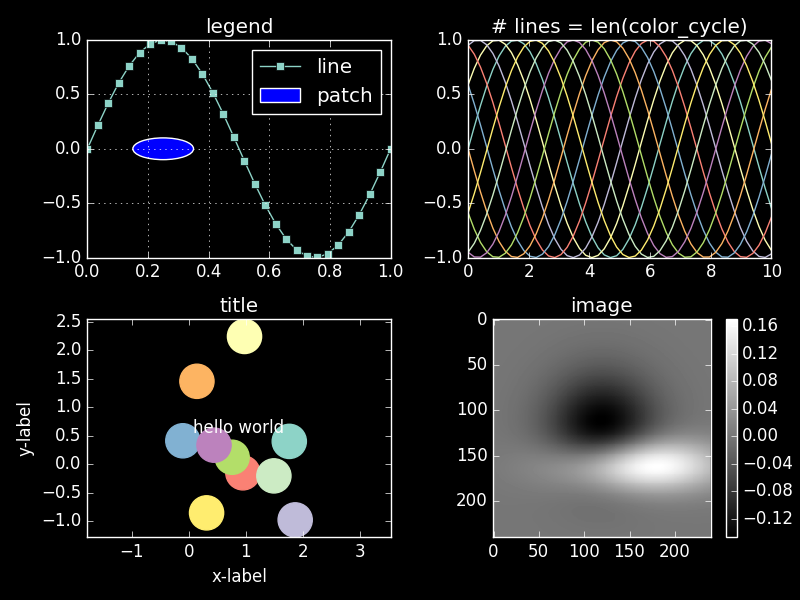
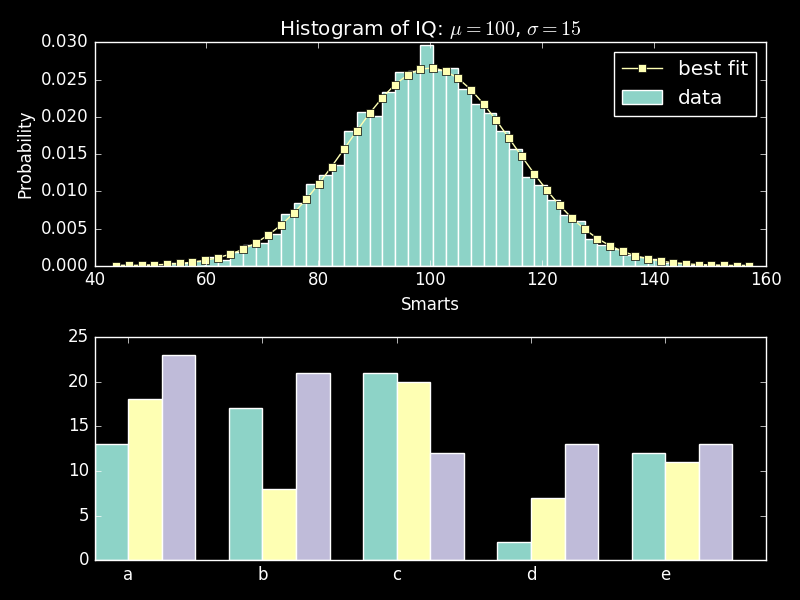
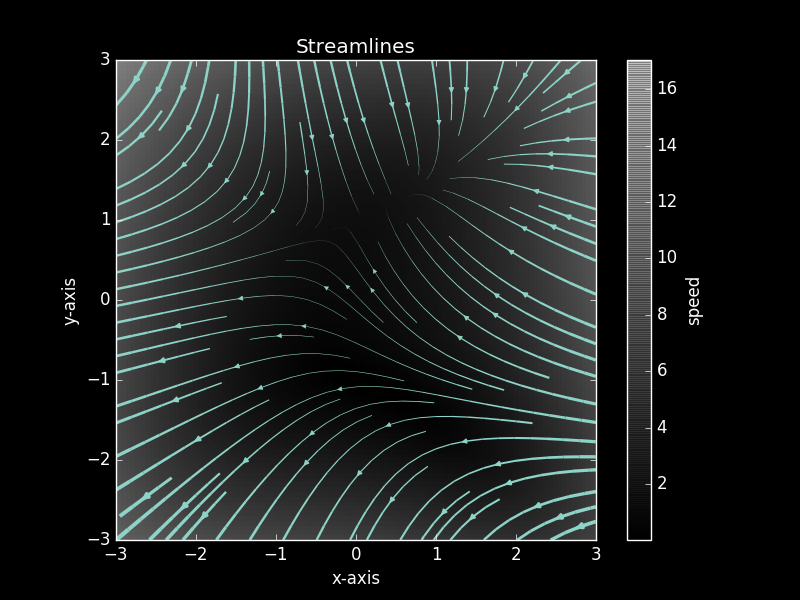


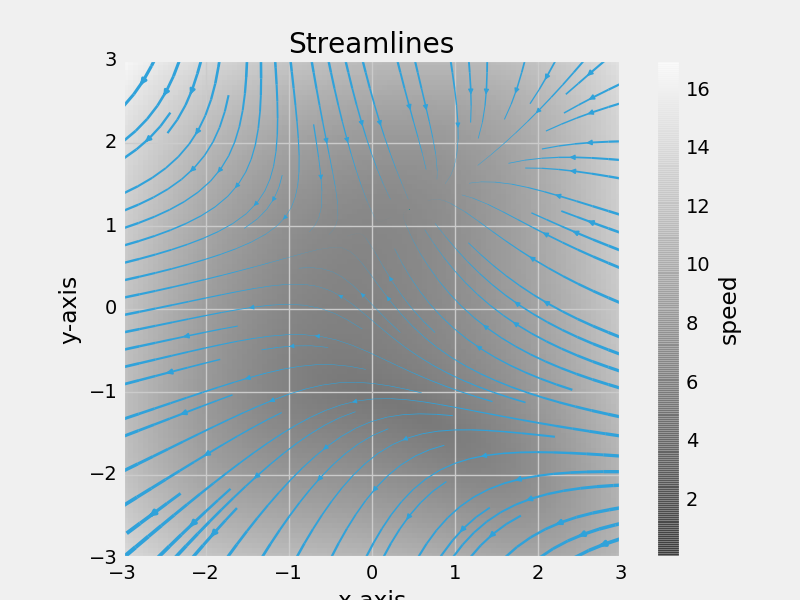
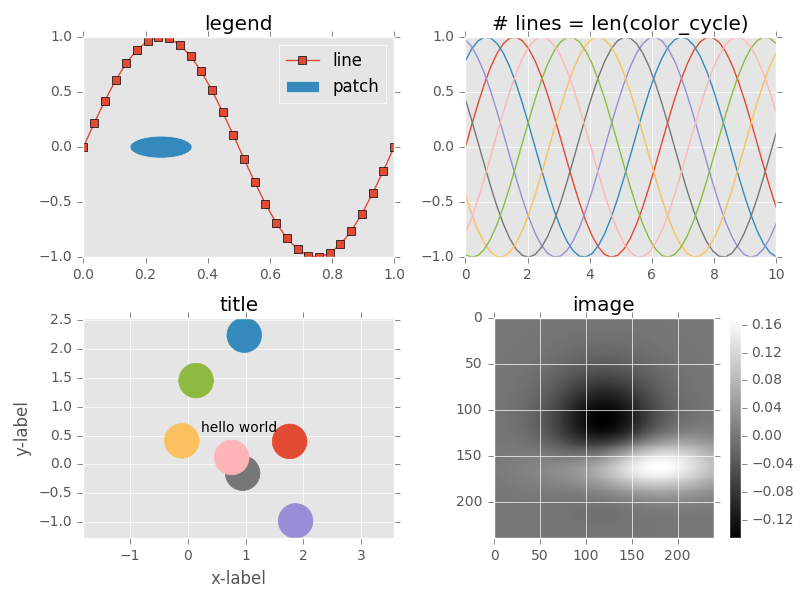

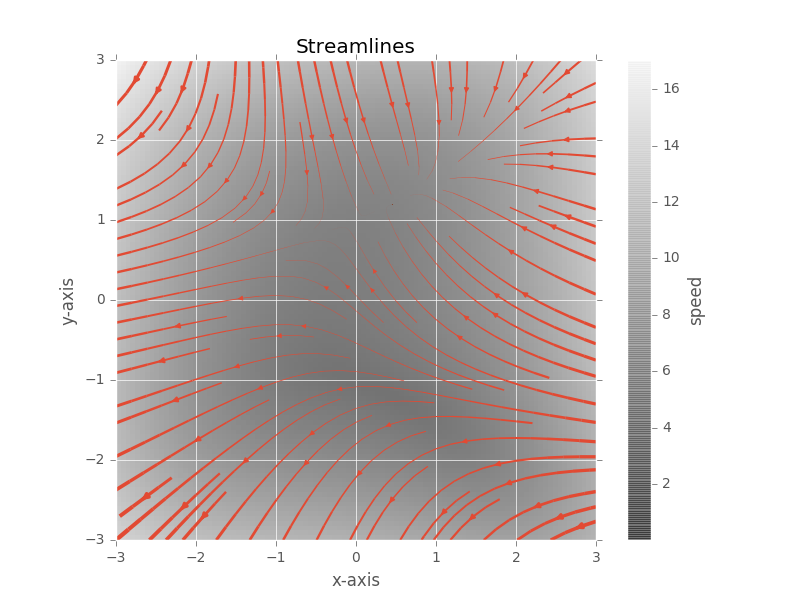
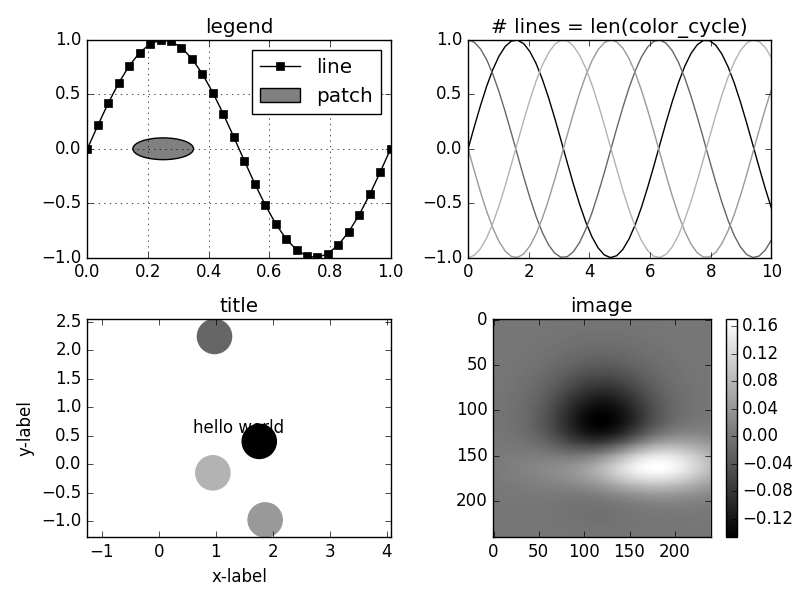


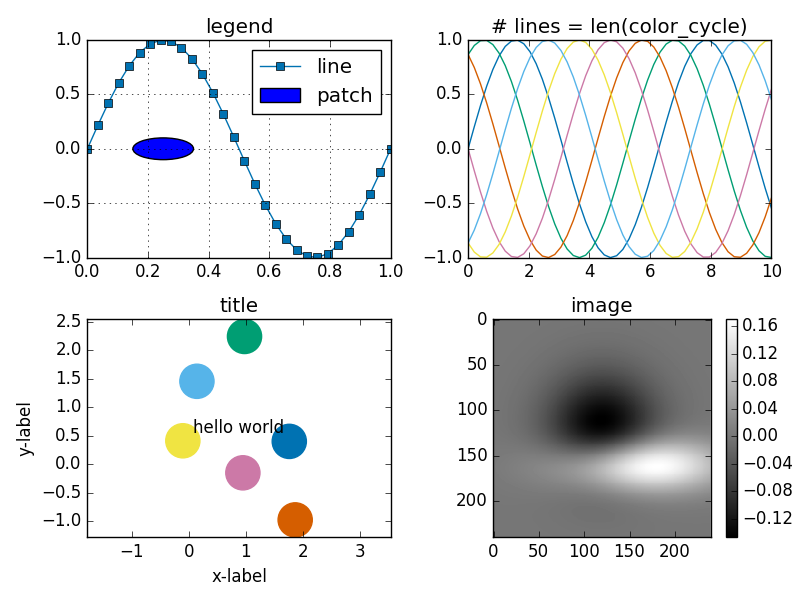
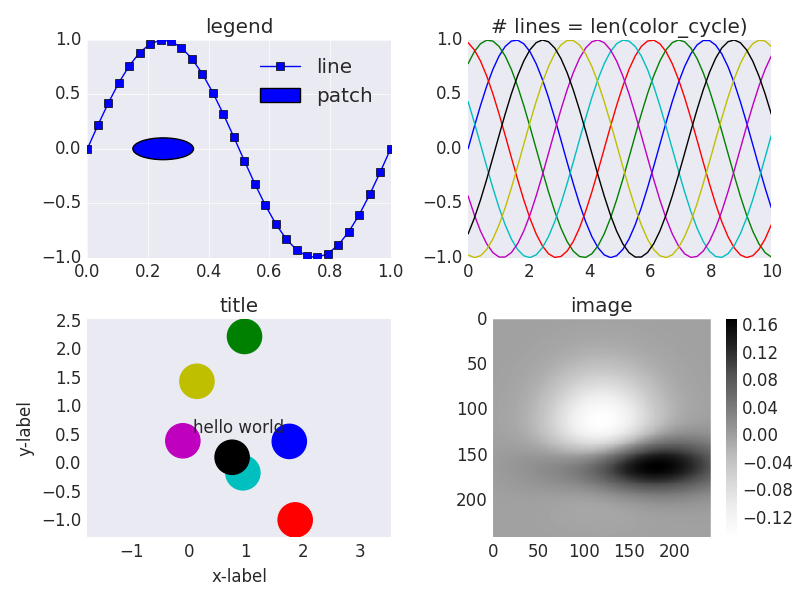
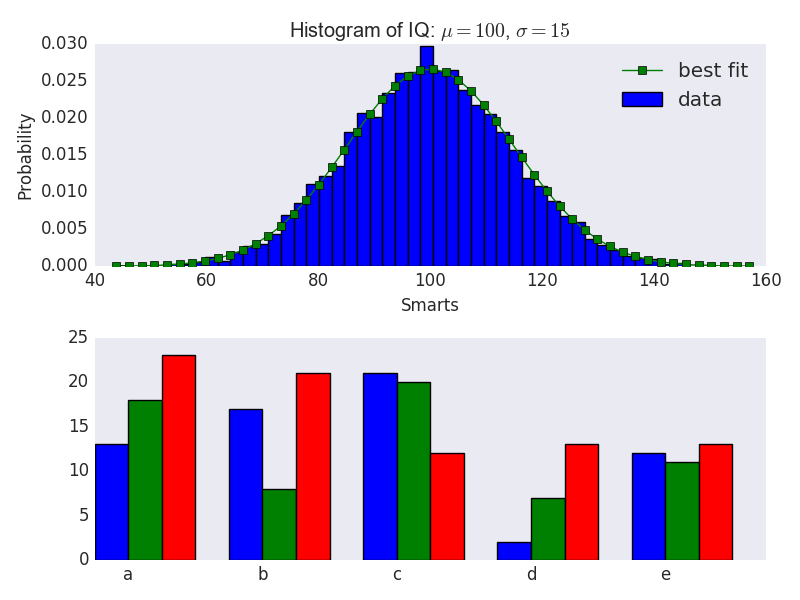


This gallery compares stylesheets defined in Matplotlib.
Note: User input has been disabled
Press Esc to close
Use arrows to switch plot
Style:
Script:
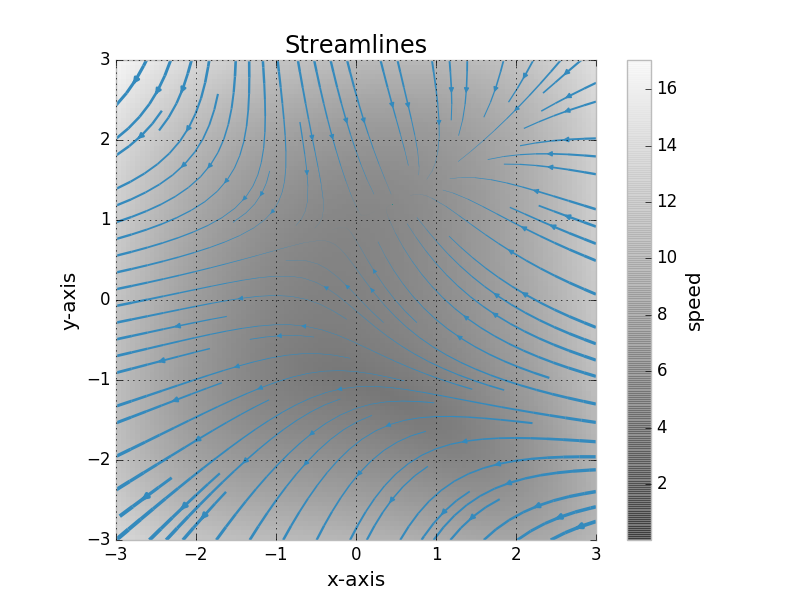
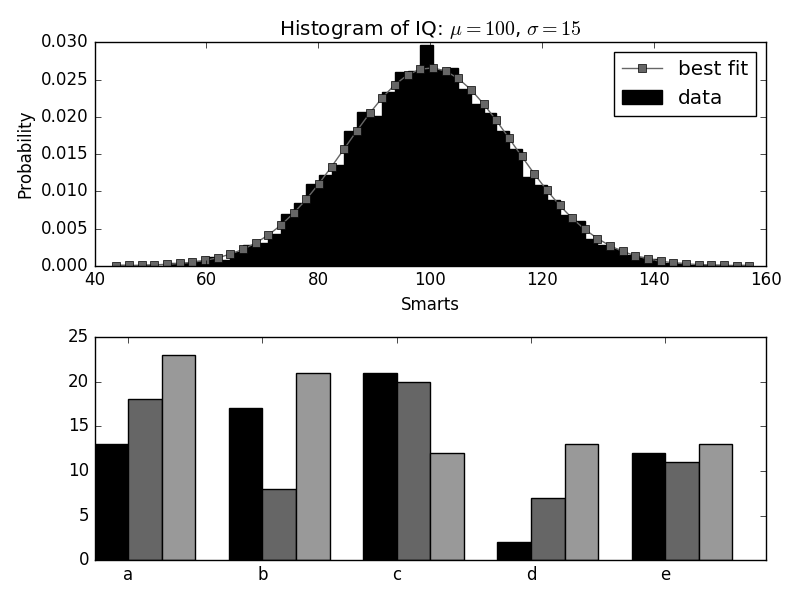
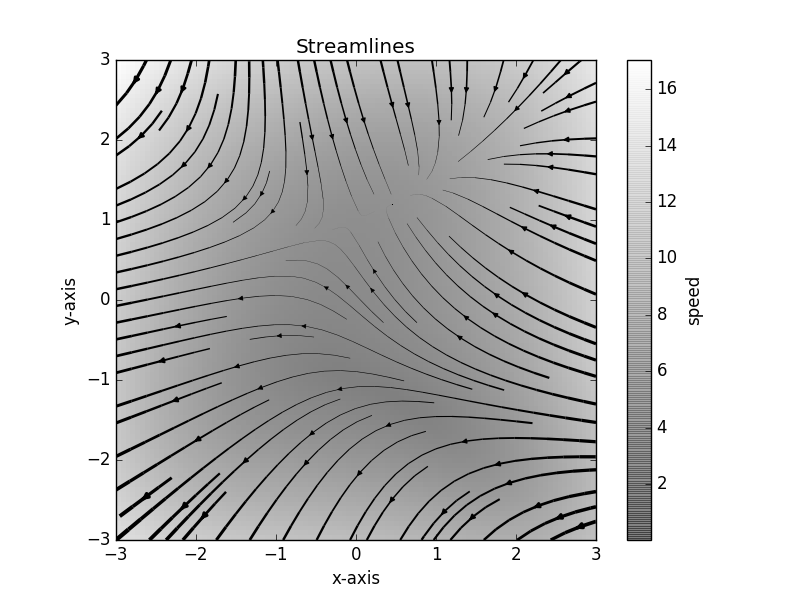
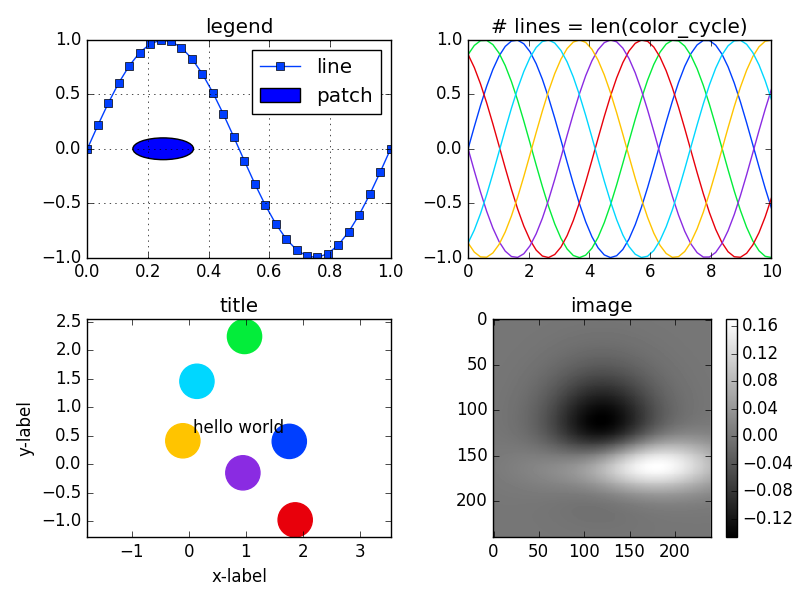
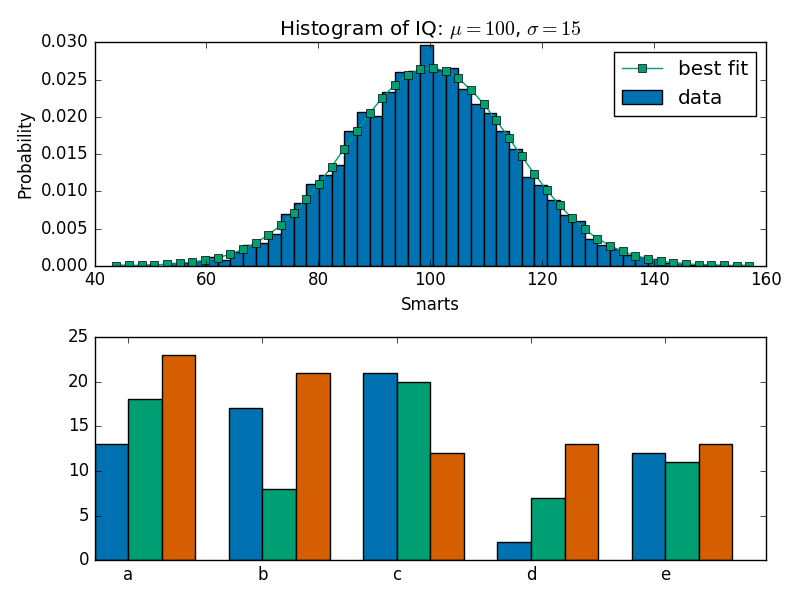
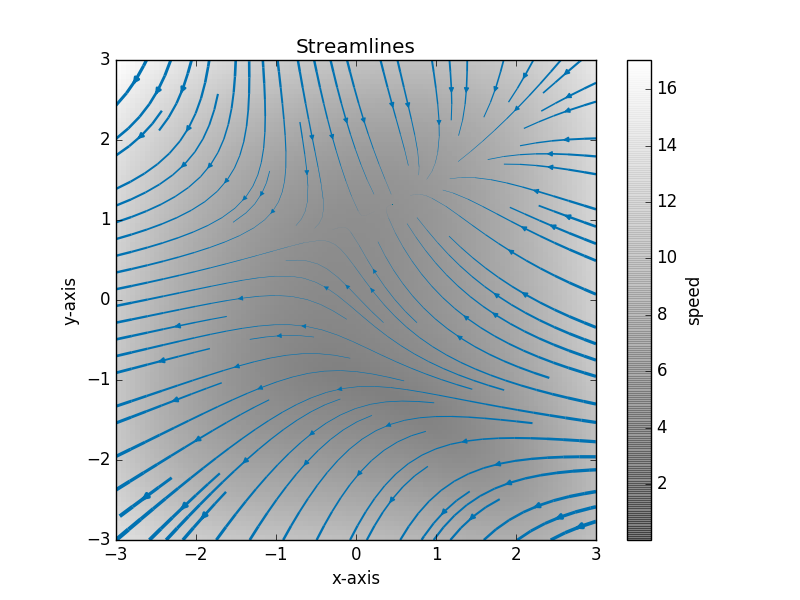
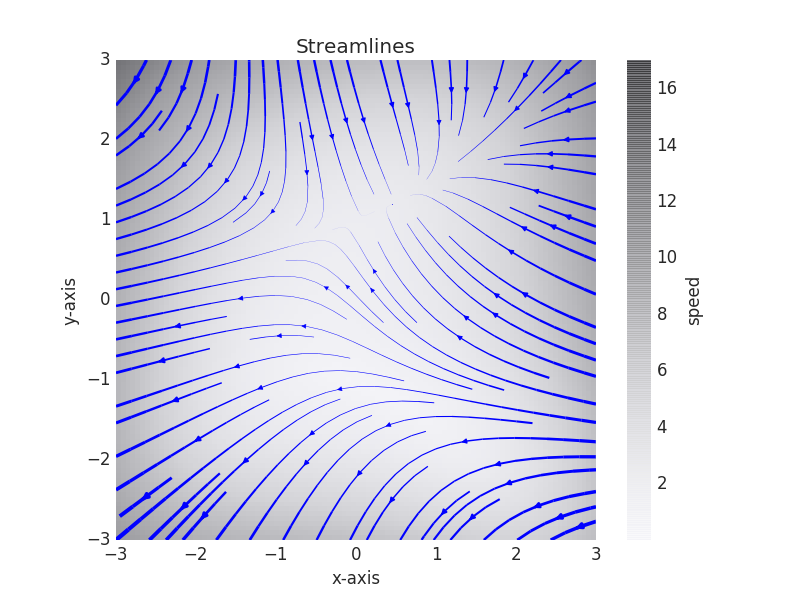
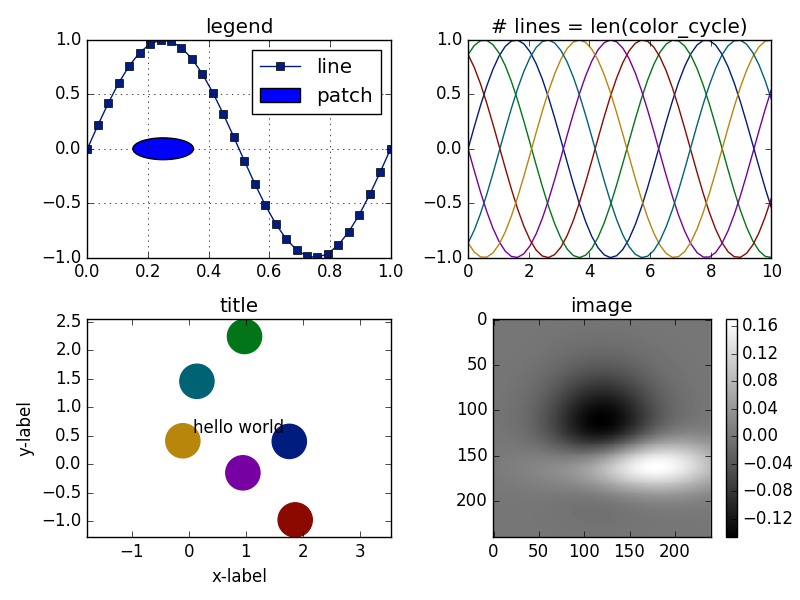
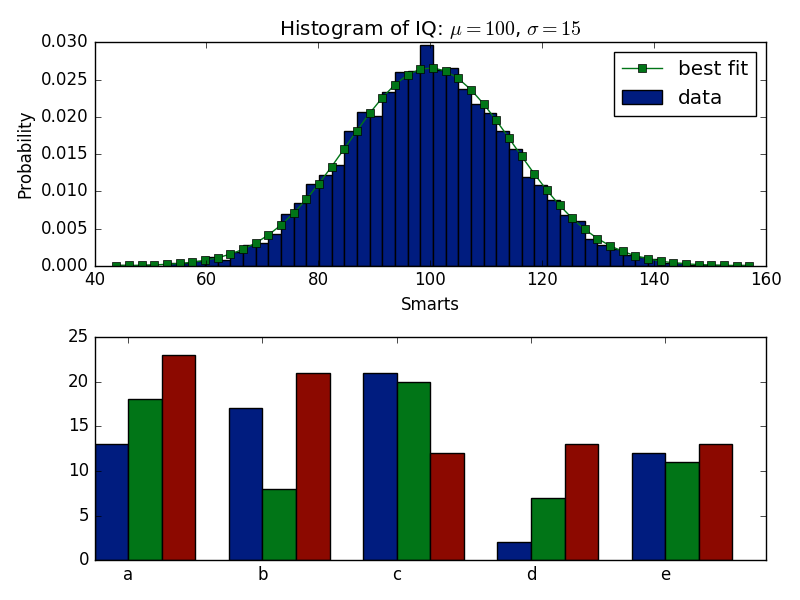
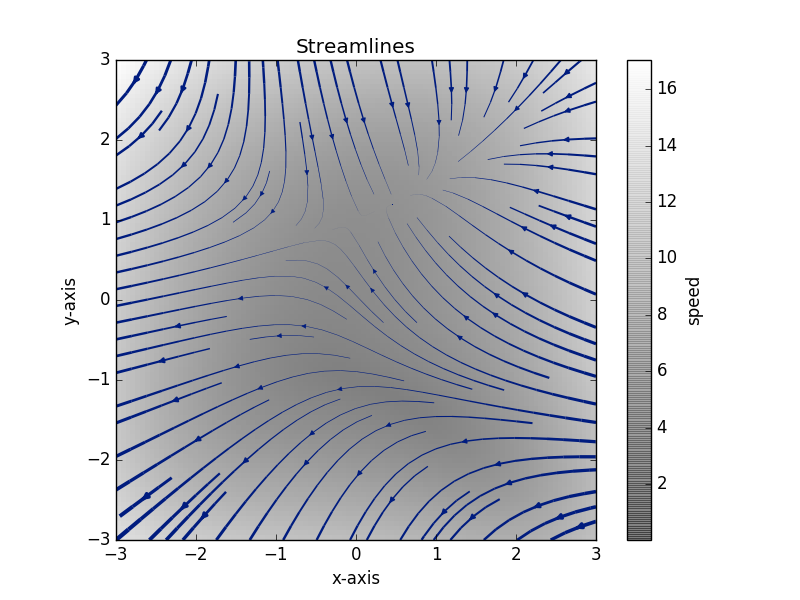
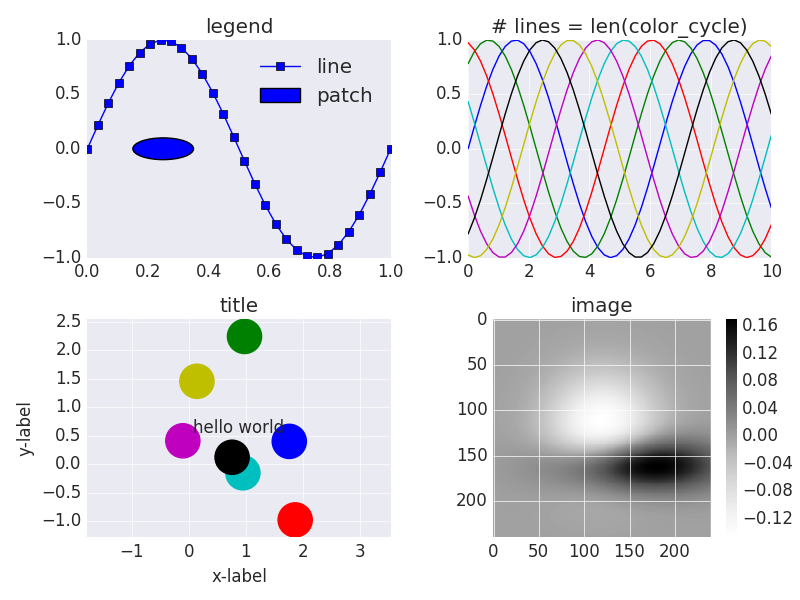
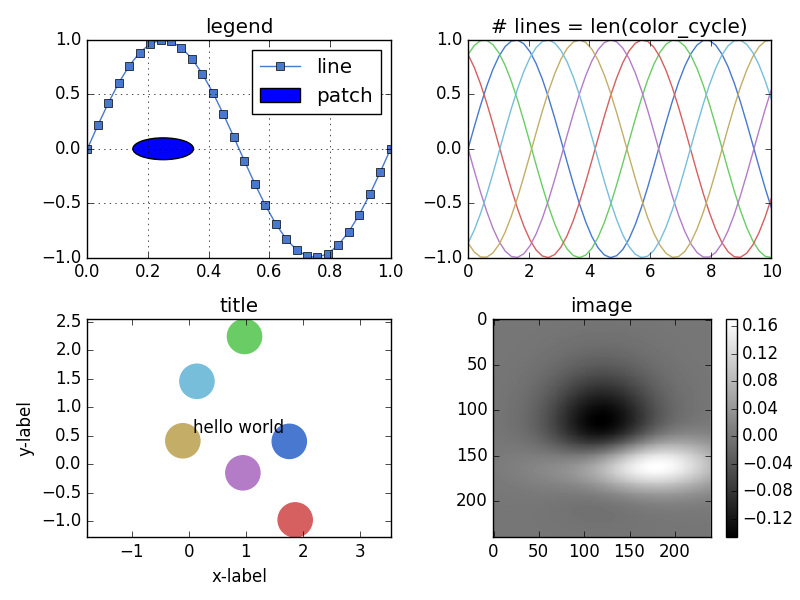
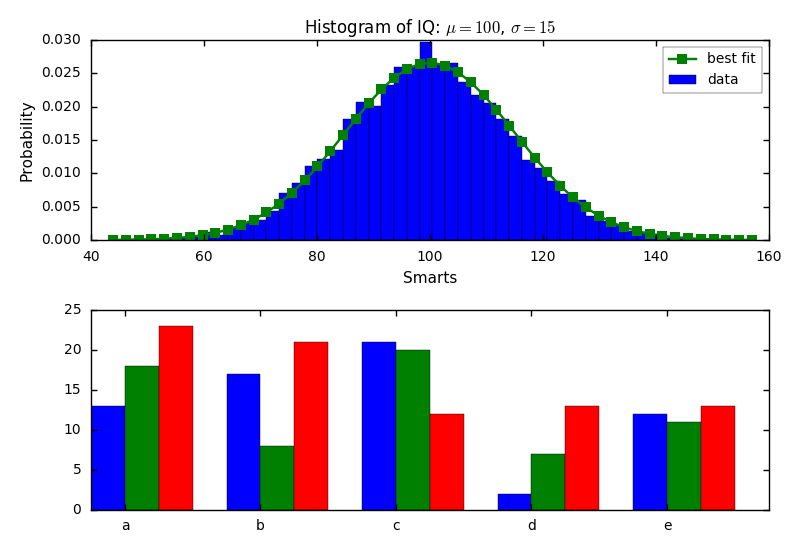
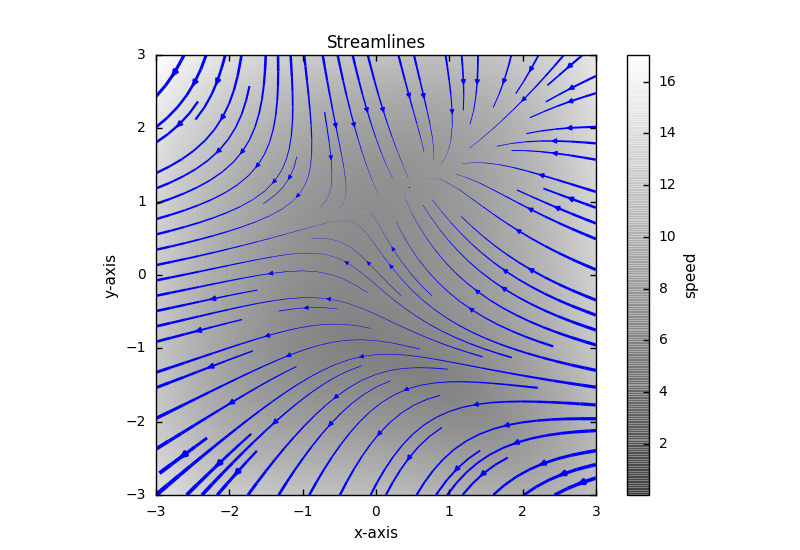
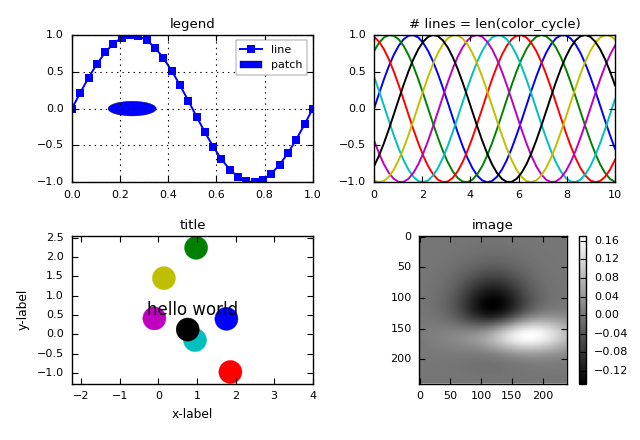
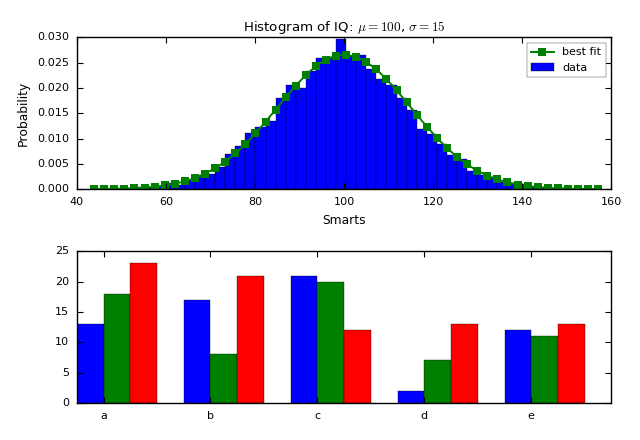
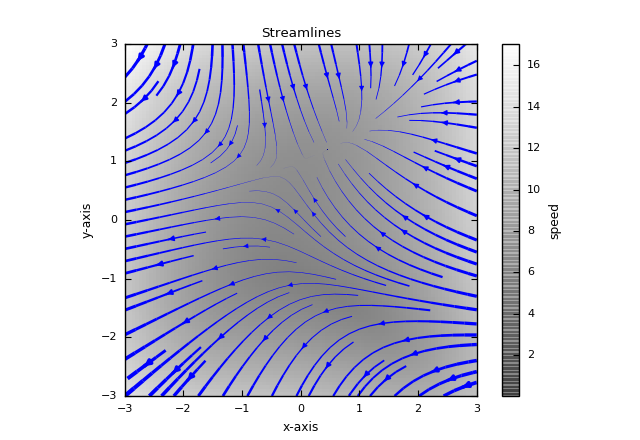
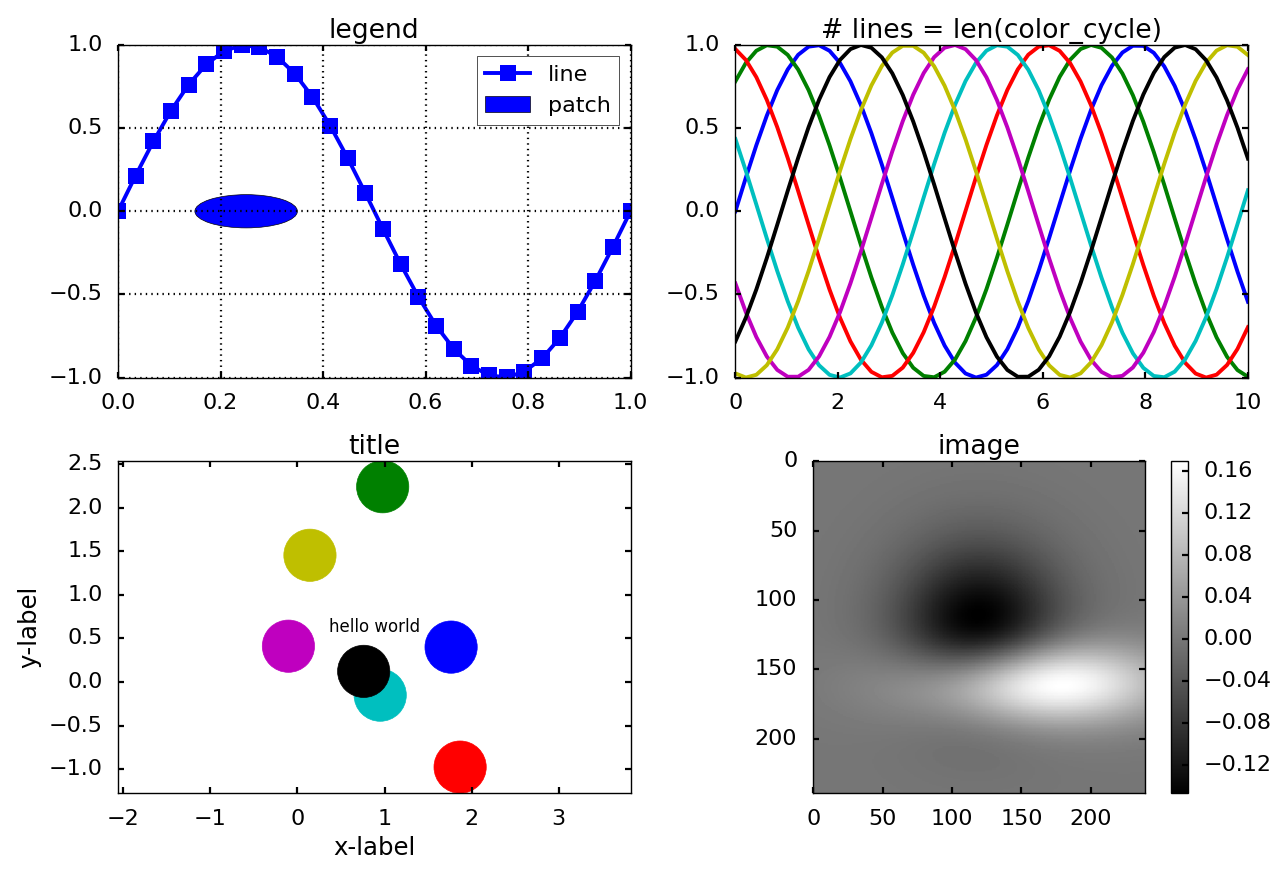
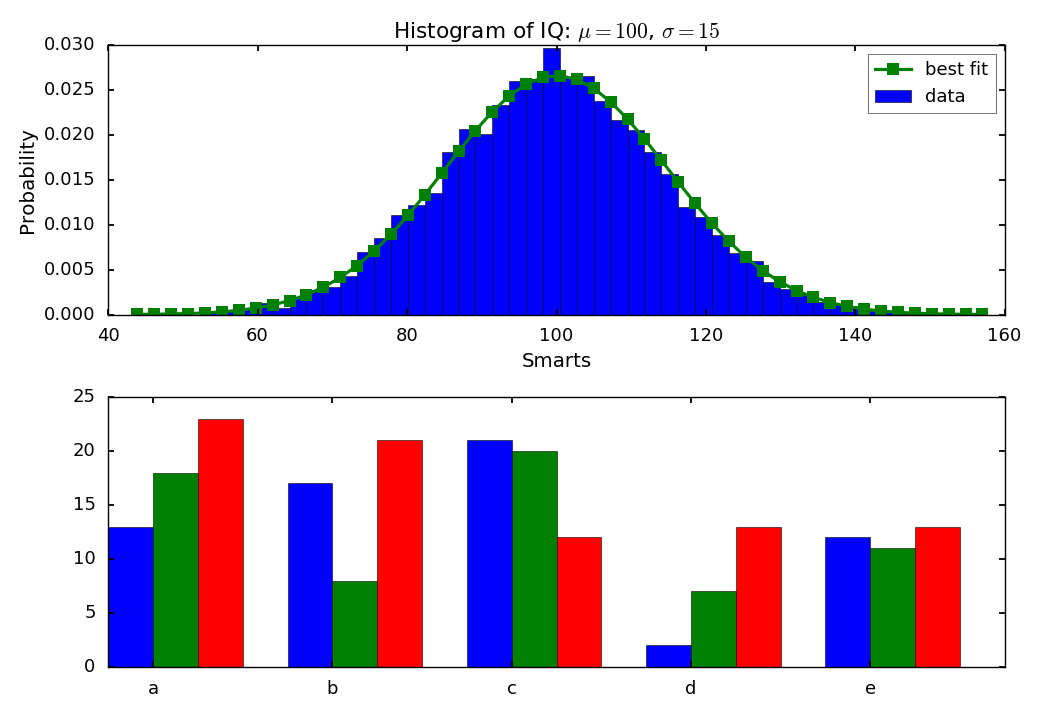
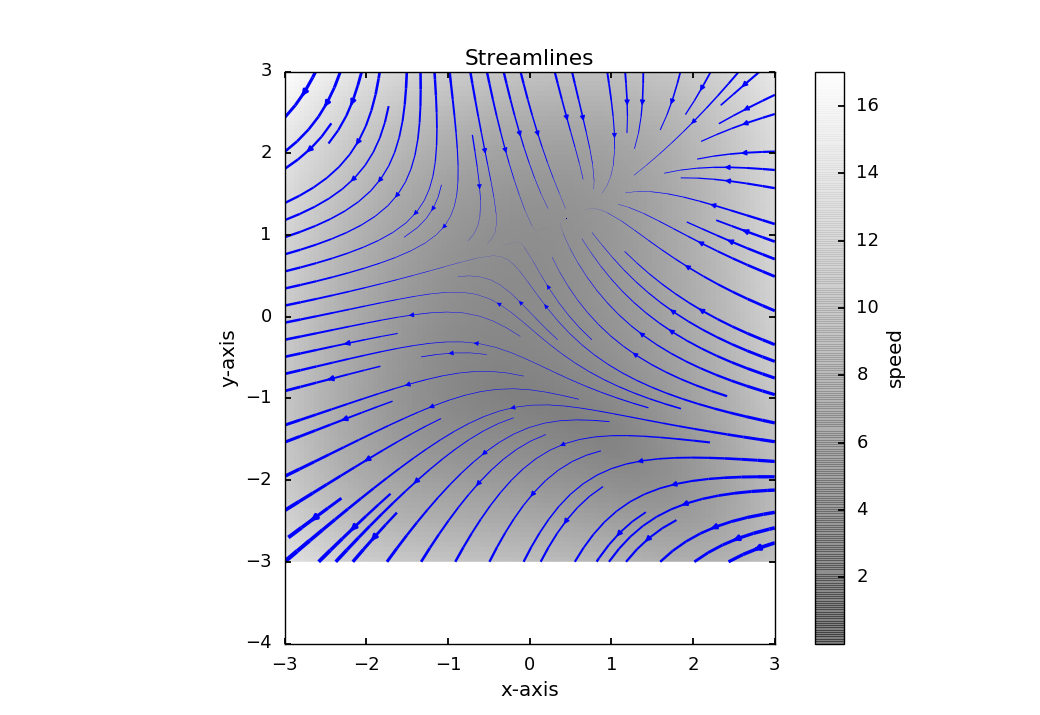
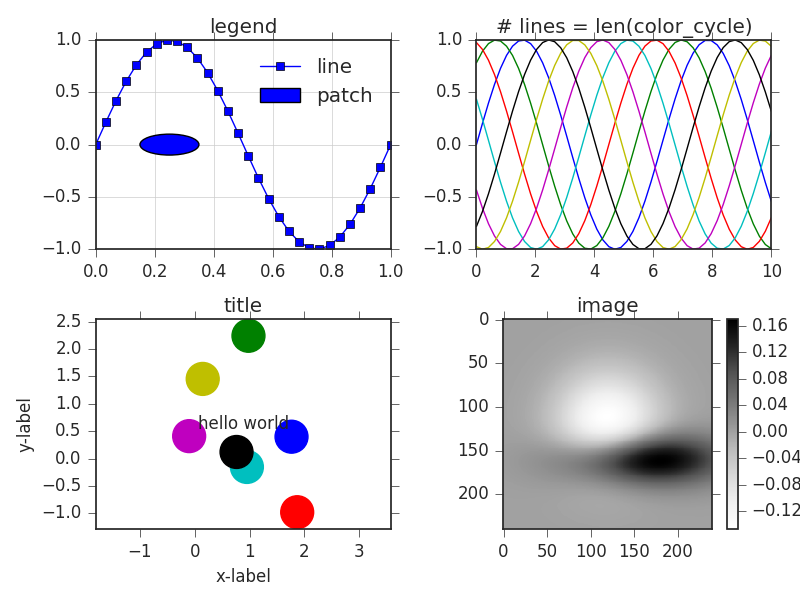
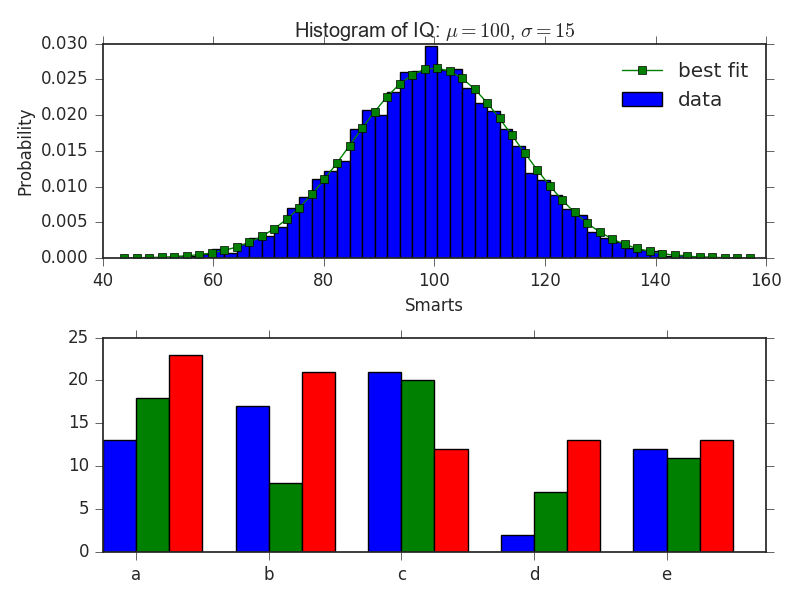
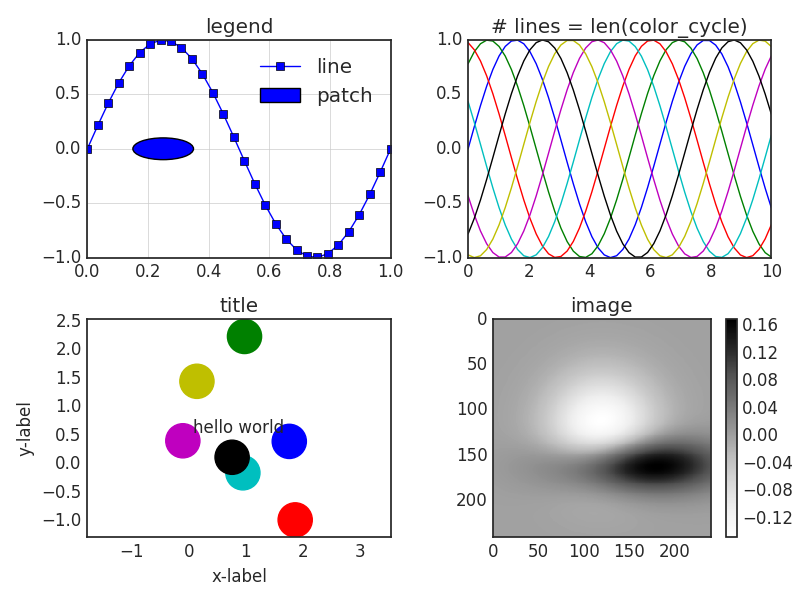
These plots were generated with the default matplotlib parameters,
plus a default colormap that was set to gray-scale and no
interpolation. You can do the same on your system by adding the following
to your ~/.matplotlib/matplotlibrc file:
    image.cmap : gray
    image.interpolation : none
Built with Matplotlib 1.5.1. Source code for this gallery available on github.