Template Matching
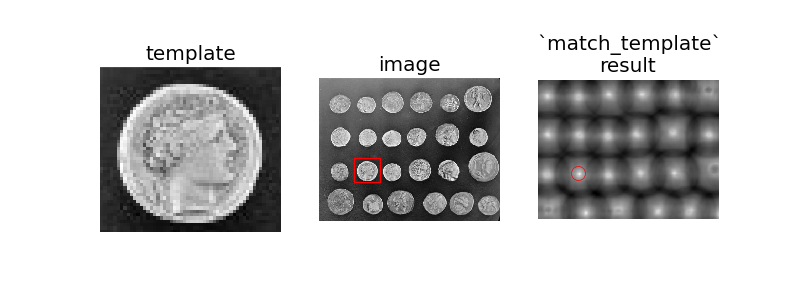
In this example, we use template matching to identify the occurrence of an image patch (in this case, a sub-image centered on a single coin). Here, we return a single match (the exact same coin), so the maximum value in the match_template result corresponds to the coin location. The other coins look similar, and thus have local maxima; if you expect multiple matches, you should use a proper peak-finding function.
The match_template function uses fast, normalized cross-correlation [1] to find instances of the template in the image. Note that the peaks in the output of match_template correspond to the origin (i.e. top-left corner) of the template.
| [1] | J. P. Lewis, “Fast Normalized Cross-Correlation”, Industrial Light and Magic. |

import numpy as np
import matplotlib.pyplot as plt
from skimage import data
from skimage.feature import match_template

image = data.coins()
coin = image[170:220, 75:130]

result = match_template(image, coin)
ij = np.unravel_index(np.argmax(result), result.shape)
x, y = ij[::-1]

fig, (ax1, ax2, ax3) = plt.subplots(ncols=3, figsize=(8, 3))

ax1.imshow(coin)
ax1.set_axis_off()
ax1.set_title('template')

ax2.imshow(image)
ax2.set_axis_off()
ax2.set_title('image')
# highlight matched region
hcoin, wcoin = coin.shape
rect = plt.Rectangle((x, y), wcoin, hcoin, edgecolor='r', facecolor='none')
ax2.add_patch(rect)

ax3.imshow(result)
ax3.set_axis_off()
ax3.set_title('`match_template`\nresult')
# highlight matched region
ax3.autoscale(False)
ax3.plot(x, y, 'o', markeredgecolor='r', markerfacecolor='none', markersize=10)

plt.show()
Python source code: download (generated using mpltools 0.6dev)
