LinearColormap
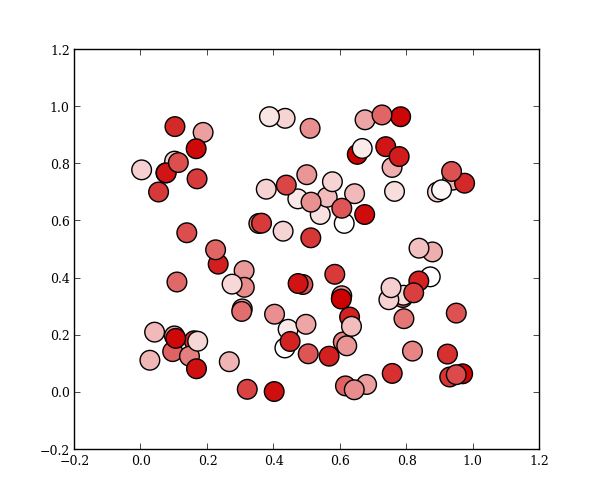
This class simplifies the creation of Matplotlib colormaps. To specify a colormap, you can just specify key colors in the colormap, and LinearColormap will distribute those colors evenly in the colormap and linearly interpolate in-between. In the example below, specifying two colors defines the minimum and maximum color values of the colormap.
import numpy as np
import matplotlib.pyplot as plt

from mpltools import color


x, y, z = np.random.uniform(size=(3, 100))

white_red = color.LinearColormap('white_red', [(1, 1, 1), (0.8, 0, 0)])
plt.scatter(x, y, c=z, cmap=white_red, s=200)
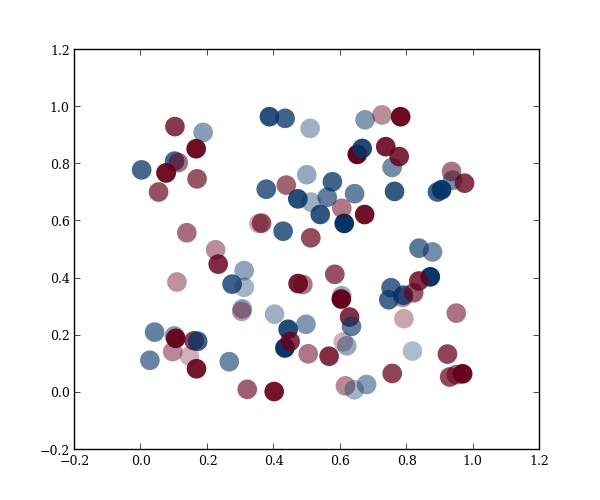
To get more complicated, use the index argument to specify where the color values map to in the colormap. Here, we repeat an index to get a segmented colormap. This colormap is uniformly blue below the midpoint and red above the midpoint. Alpha values are maximum at the edges and minimum in the middle.
bcr_rgba = [(0.02, 0.2, 0.4, 1),    # grayish blue, opaque
            (0.02, 0.2, 0.4, 0.3),  # grayish blue, transparent
            (0.4,  0.0, 0.1, 0.3),  # dark red, transparent
            (0.4,  0.0, 0.1, 1)]    # dark red, opaque
blue_clear_red = color.LinearColormap('blue_clear_red', bcr_rgba,
                                      index=[0, 0.5, 0.5, 1])


plt.figure()
plt.scatter(x, y, c=z, cmap=blue_clear_red, s=200, edgecolors='none')
plt.show()
Python source code: download (generated using mpltools 0.2dev)