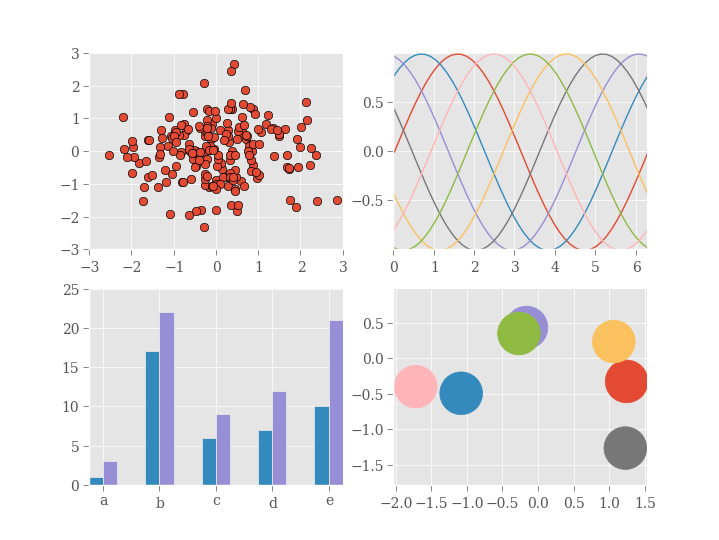
ggplot style
A key feature of mpltools is the ability to set “styles”—essentially, stylesheets that are similar to matplotlibrc files. This example demonstrates the “ggplot” style, which adjusts the style to emulate ggplot (a popular plotting package for R).
These settings were shamelessly stolen from [1].
| [1] | http://www.huyng.com/posts/sane-color-scheme-for-matplotlib/ |
import numpy as np
import matplotlib.pyplot as plt

from mpltools import style
from mpltools import layout

style.use('ggplot')

figsize = layout.figaspect(scale=1.2)
fig, axes = plt.subplots(ncols=2, nrows=2, figsize=figsize)
ax1, ax2, ax3, ax4 = axes.ravel()

# scatter plot (Note: `plt.scatter` doesn't use default colors)
x, y = np.random.normal(size=(2, 200))
ax1.plot(x, y, 'o')

# sinusoidal lines with colors from default color cycle
L = 2*np.pi
x = np.linspace(0, L)
ncolors = len(plt.rcParams['axes.color_cycle'])
shift = np.linspace(0, L, ncolors, endpoint=False)
for s in shift:
    ax2.plot(x, np.sin(x + s), '-')
ax2.margins(0)

# bar graphs
x = np.arange(5)
y1, y2 = np.random.randint(1, 25, size=(2, 5))
width = 0.25
ax3.bar(x, y1, width)
ax3.bar(x+width, y2, width, color=plt.rcParams['axes.color_cycle'][2])
ax3.set_xticks(x+width)
ax3.set_xticklabels(['a', 'b', 'c', 'd', 'e'])

# circles with colors from default color cycle
for i, color in enumerate(plt.rcParams['axes.color_cycle']):
    xy = np.random.normal(size=2)
    ax4.add_patch(plt.Circle(xy, radius=0.3, color=color))
ax4.axis('equal')
ax4.margins(0)

# Remove ticks on top and right sides of plot
for ax in axes.ravel():
    layout.cross_spines(ax=ax)

plt.show()

Python source code: download (generated using mpltools 0.2dev)
