Multiple styles
You can specify multiple plot styles by passing a list of style names to style.use. The styles are evaluated from the first to last element of the list, so if there are settings that are defined in multiple styles, the settings in the later style files will override those in the earlier files.
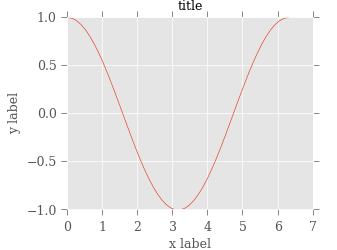
In this example, the ‘ggplot’ style alters the colors of elements to make the plot pretty, and the ‘pof’ style (Physics of Fluids journal) alters the figure size so that it fits in a column, alters line and text sizes, etc.
import numpy as np
import matplotlib.pyplot as plt

from mpltools import style

style.use(['ggplot', 'pof'])

x = np.linspace(0, 2 * np.pi)
plt.plot(x, np.cos(x))
plt.xlabel('x label')
plt.ylabel('y label')
plt.title('title')

plt.show()
Python source code: download (generated using mpltools 0.2dev)