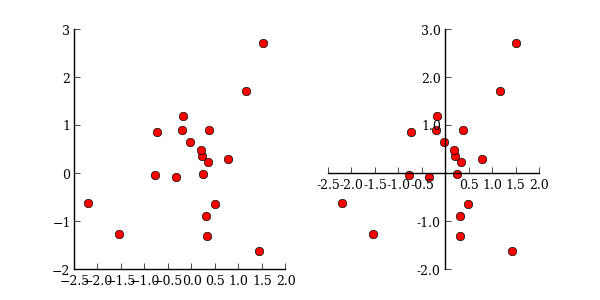
Crossed spines
By default, matplotlib surrounds plot axes with borders. cross_spines` uses the axes ``spines (the names axes and axis were already taken) attribute to eliminate the top and right spines from the plot.
import numpy as np
import matplotlib.pyplot as plt

from mpltools import layout


figsize = layout.figaspect(aspect_ratio=0.5)
fig, (ax1, ax2) = plt.subplots(ncols=2, figsize=figsize)

x, y = np.random.normal(size=(2, 20))

layout.cross_spines(ax=ax1)
ax1.plot(x, y, 'ro')

layout.cross_spines(zero_cross=True, ax=ax2)
ax2.plot(x, y, 'ro')

plt.show()

Python source code: download (generated using mpltools 0.2dev)
