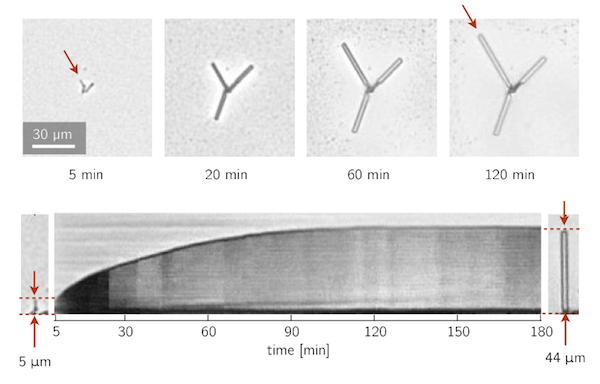
Top: Successive snapshots of a cluster of needles growing during solvent-annealing. The top-left needle from the cluster is tracked over time in the bottom image.
Bottom: Slice of micrograph-pixels along the axis of a needle as a function of time. The dark curved line is the location of the needle tip of the needle as a function of time. The images on the left and right show the needle near the beginning and end of the annealing process.