This post is more than a year in the making (life got in the way), so this isn't exactly hot off the press. I added support for style-sheets back in Matplotlib 1.4, based on my implementation in mpltools [1], and built a gallery page to easily compare styles.
Style-sheets allow you to turn a plot that looks like this:
import numpy as np
import matplotlib.pyplot as plt

x = np.random.randn(1000, 3)

plt.hist(x, 10)
plt.show()
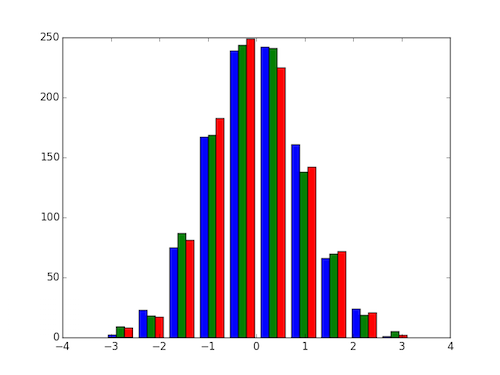
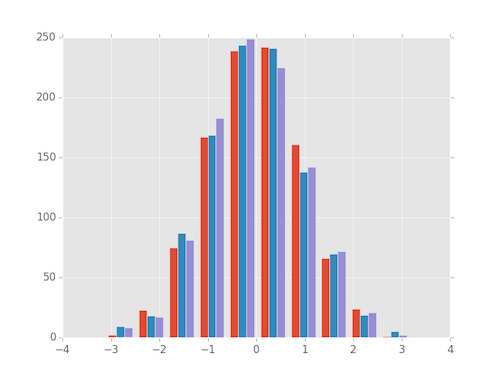
Into a plot that looks like this:
plt.style.use('ggplot')
plt.hist(x, 10)
plt.show()
Currently, there are only a handful of style-sheets included with Matplotlib, but even now, it may be difficult to choose between what's available [2]. For easier comparison, I've created a gallery page to easily compare existing style-sheets:

You can select a given plot to zoom in and navigate between zoomed in plots with arrow keys.
This page disables user input, but the actual gallery app (github repo) also allows you to compare custom style-sheets by passing a URL, or explicitly defining a style sheet (using matplotlibrc syntax).
| [1] | https://github.com/matplotlib/matplotlib/pull/2236 |
| [2] | https://github.com/matplotlib/matplotlib/pull/3190 |
Comments
comments powered by Disqus